Environmental Impact Reduction Target
| 2023 | 2024 | 2025 | 2026 | 2030 | 2050 | |||
|---|---|---|---|---|---|---|---|---|
| Environmental indicator | Unit | Result | Result | Target | Result | Target | Target | Target |
| Green House Gas emission | Million tonCO2 | 1.05 | 0.87 | 1.18 | 0.82 | 1.14 | 1.01 | 0 |
| Green House Gas intensity | KgCO2/ton production | 398 | 394 | 387 | 362 | 270 | ||
| Energy consumption | GJ/ton production | 5.3 | 5.4 | 5.5 | 5.3 | 5.5 | 5.5 | |
| Water withdrawal | Million cubic meter | 2.70 | 2.58 | 2.50 | ||||
| Water withdrawal intensity | cu.m./ton production | 1.02 | 1.11 | 0.96 | 1.11 | 1.11 | 1.11 | |
| Recycle water usage | Million cubic meter | 1.97 | 1.64 | 1.28 | ||||
| Recycle water usage rate | % | 42% | 39% | >33% | 34% | >33% | >33% | |
| Water discharge | Million cubic meter | 0.28 | 0.18 | 0.15 | ||||
| Water discharge to freshwater | Million cubic meter | 0.00 | 0.00 | 0.00 | 0.00 | 0.00 | 0.00 | |
| Water discharge to 3rd party | Million cubic meter | 0.28 | 0.18 | 0.15 | ||||
| Waste generation | kg/ton production | 20.44 | 18.53 | 18.8 | 19.0 | 18.8 | 18.8 | |
| Waste to recycle | % | 99.5% | 98.9% | >90% | 99.0% | >90% | >90% | |
| Waste to incineration | % | 0.5% | 1.1% | 1.0% | ||||
| Waste to landfill | % | 0% | 0% | 0% | 0% | 0% | 0% | |
| Raw material usage | Million ton | 2.80 | 2.49 | 2.22 | ||||
| Recycle material usage | Million ton | 0.23 | 0.23 | 0.22 | ||||
| Recycle content | % | 8.2% | 9.1% | 9.0% | 9.8% | 9.0% | 9.0% | |
| Renewable material usage | ton | 0 | 0 | 85 | ||||
| Renewable content | % | 0% | 0% | 0.004% | ||||
Note : *3rd party is industrial estate wastewater treatment plant that return water to use in estate.
| Air pollution indicator | Max value of monitoring result | |||||
|---|---|---|---|---|---|---|
| Unit | Lagal Standard | Company control | 2023 | 2024 | 2025 | |
| Dust emission | ||||||
| Thailand | mg/m3 | 320 | 150 | 41 | 35 | 35 |
| Vietnam | mg/m3 | 200 | 150 | 132 | 125 | 76 |
| Indonesia | mg/m3 | 150 | 150 | 55 | 56 | 56 |
| Philippines | mg/m3 | 150 | 150 | 89 | 53 | 127 |
| NOx emission | ||||||
| Thailand | ppm | 200 | 150 | 21 | 11 | 13 |
| Vietnam | ppm | 191 | 150 | 76 | 29 | 50 |
| Indonesia | ppm | 319 | 150 | 6 | 21 | 32 |
| Philippines | ppm | 532 | 250 | 144 | 137 | 235 |
| SOx emission | ||||||
| Thailand | ppm | 60 | 50 | 13 | 7 | 4 |
| Vietnam | ppm | 452 | 50 | 61 | 16 | 6 |
| Indonesia | ppm | 152 | 50 | 32 | 5 | 6 |
| Philippines | ppm | 573 | 250 | 50 | 43 | 130 |

Innovation Meets
Sustainability
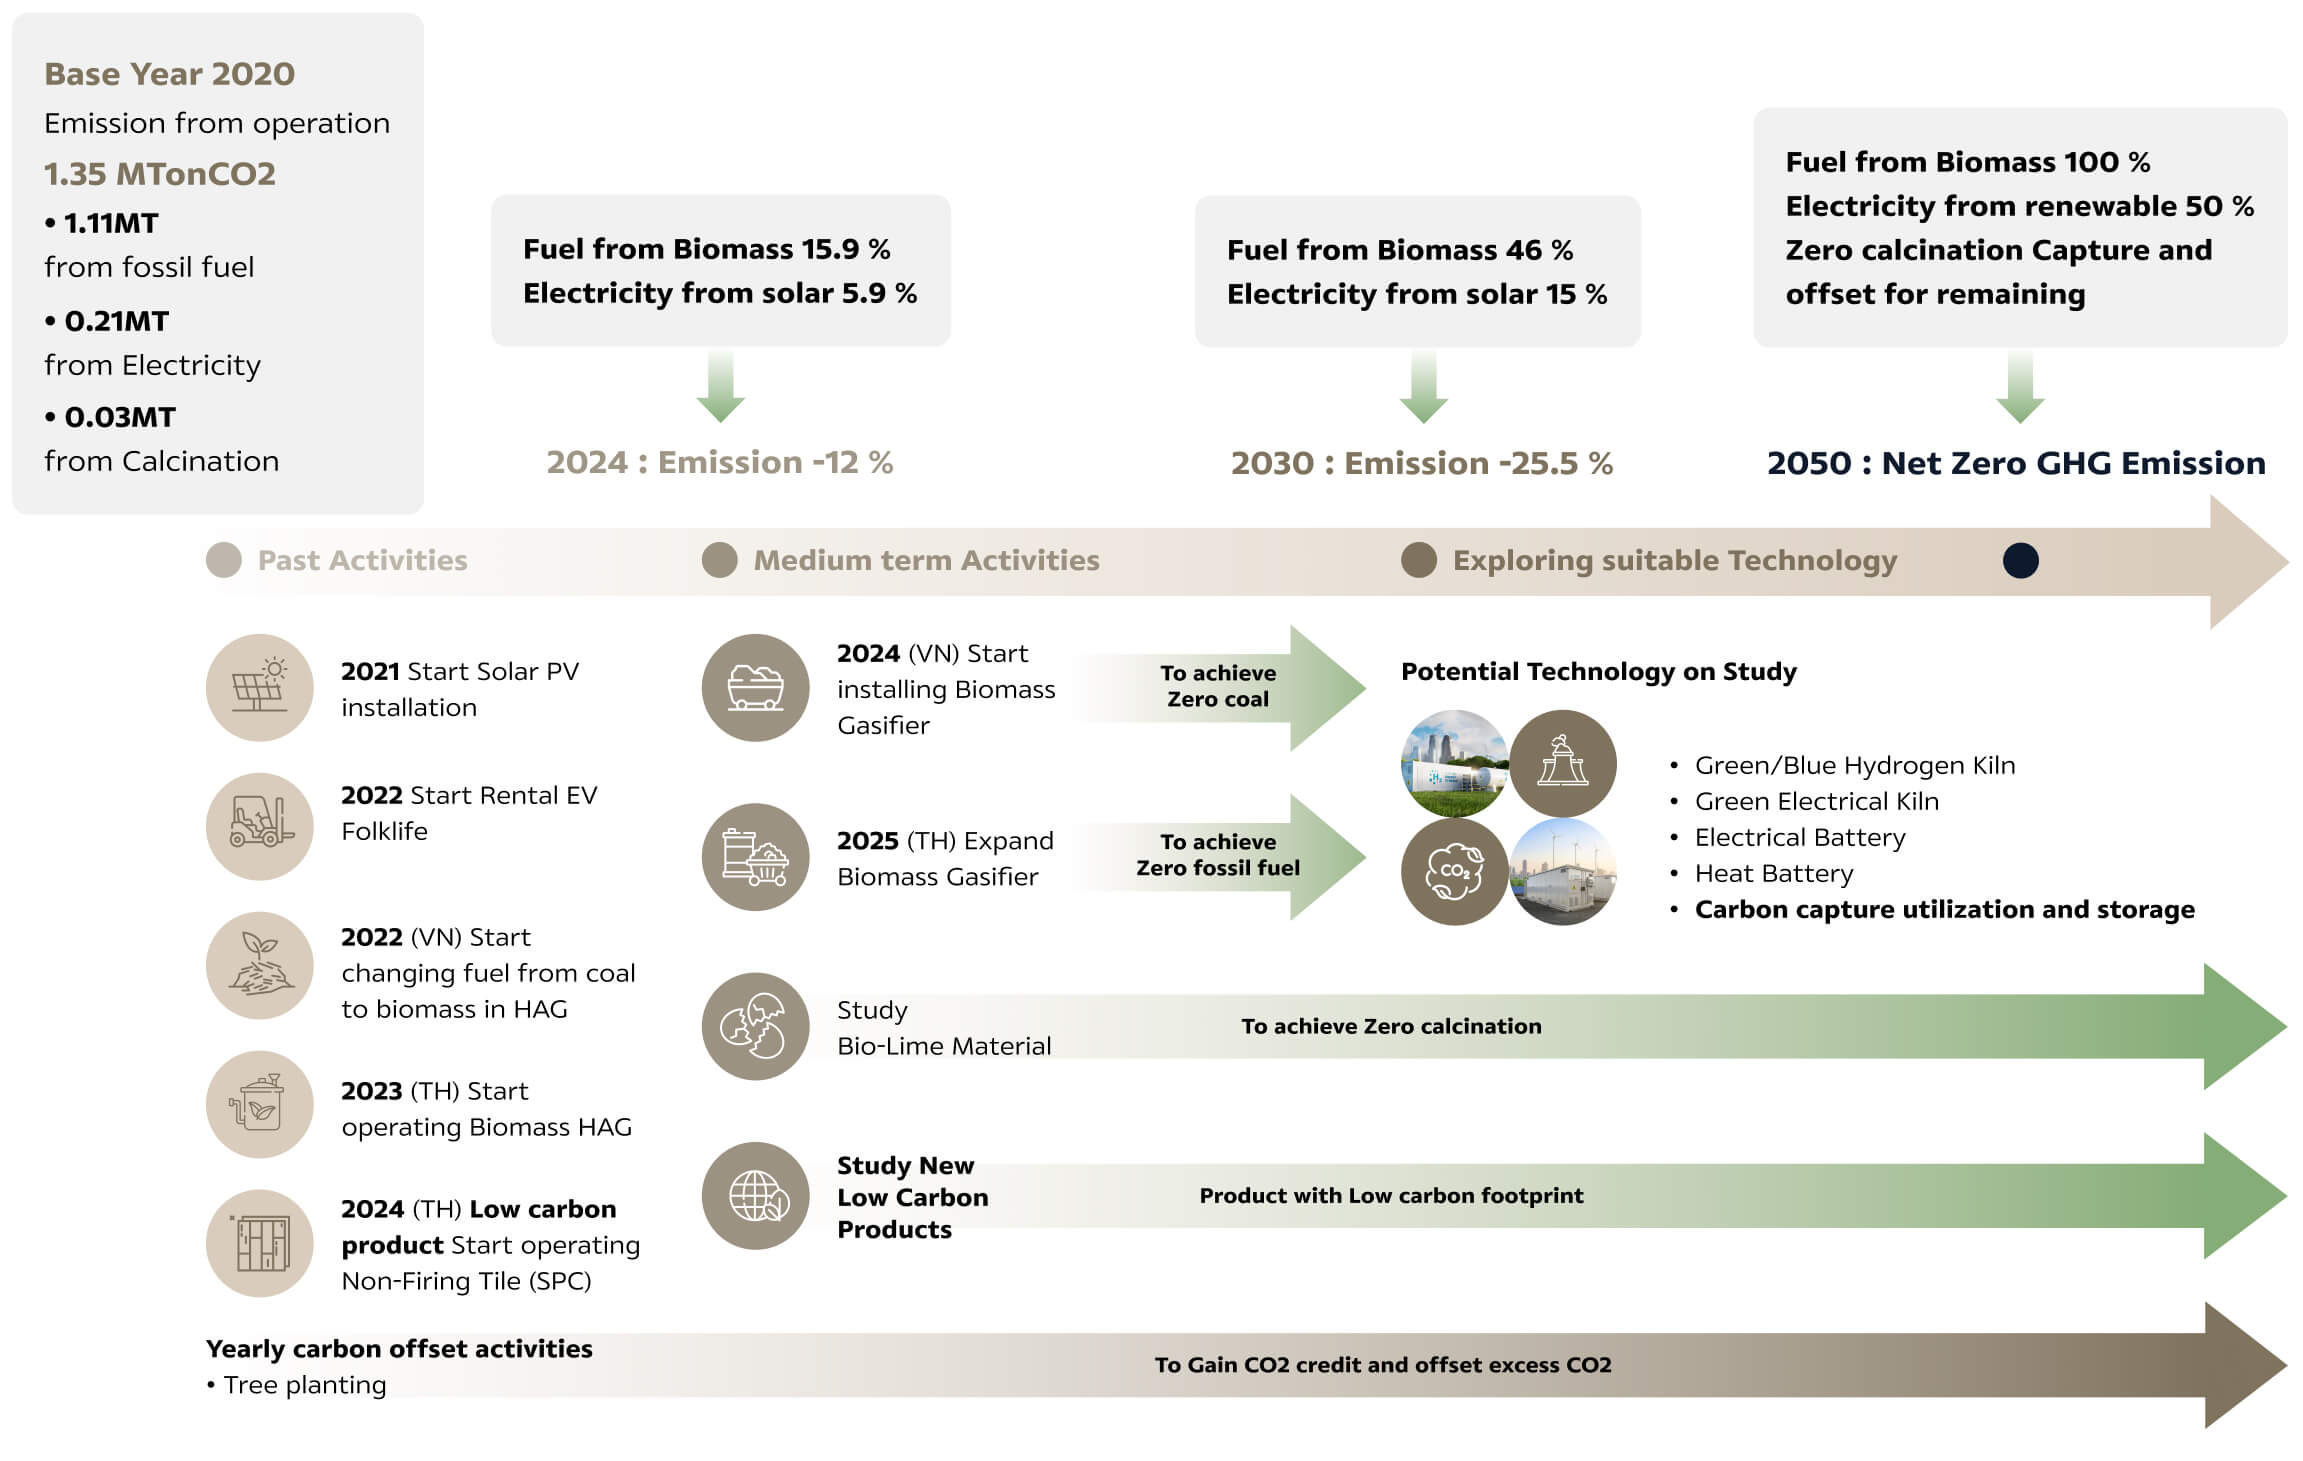
SCG Decor Decarbonization Roadmap